Candlestick patterns have been a go-to tool for traders for centuries, originating from Japanese rice markets in the 1700s. Today, they’re essential in stock, forex, crypto, and other markets, helping spot potential price reversals or continuations. If you’re new to trading or looking to sharpen your skills, understanding these patterns can give you an edge in reading market sentiment.
Each candlestick on a chart represents a specific time period, like a day or an hour, showing the open, high, low, and close prices. The “body” is the thick part between open and close, colored green for bullish (price up) or red for bearish (price down). The thin lines, or “wicks,” show the highs and lows, revealing battles between buyers and sellers.
A trading candlestick patterns cheat sheet simplifies this by summarizing key formations in one place. It’s like a quick reference guide to help you identify signals without memorizing everything. In this article, we’ll break it down step by step, from basics to advanced tips, all in easy-to-follow language.
Basics of Candlestick Charts
Before diving into patterns, let’s cover the fundamentals. A single candlestick tells a story about price action in a given timeframe. If the close is higher than the open, it’s bullish—buyers won the session. A lower close means bearish, with sellers in control. Long bodies indicate strong momentum, while short ones suggest indecision.
Wicks are crucial too. A long upper wick shows sellers pushed prices down after a high, hinting at resistance. A long lower wick means buyers stepped in after a low, signaling support. Combining these with volume and other indicators like moving averages boosts accuracy.
Charts come in various timeframes: daily for long-term trends, hourly for day trading. Always consider the bigger picture— a pattern on a 5-minute chart might mean little if the daily trend opposes it. Practice on demo accounts to get comfortable spotting these elements.
Types of Candlestick Patterns
Candlestick patterns fall into categories based on the number of candles involved. Single ones give quick signals, while multi-candle patterns offer more confirmation. We’ll explore bullish (uptrend signals), bearish (downtrend signals), and neutral ones.
Single Candlestick Patterns
These standalone formations can hint at reversals or continuations. For example, the Hammer looks like a hammer with a small body at the top and a long lower wick. It appears after a downtrend, suggesting buyers are fighting back.
The Shooting Star is its bearish cousin, with a small body at the bottom and long upper wick, often after an uptrend. Doji, where open and close are almost the same, shows indecision—could go either way depending on context.
Other singles include the Marubozu (full body, no wicks) for strong trends, and Spinning Top (small body, long wicks) for uncertainty.
Double Candlestick Patterns
These involve two candles and are great for spotting reversals. Bullish Engulfing: A red candle followed by a larger green one that “engulfs” it, signaling a shift from sellers to buyers.
Bearish Engulfing is the opposite: green followed by a bigger red. Piercing Line: After a downtrend, a red candle followed by a green that opens lower but closes above the midpoint of the prior candle.
Tweezer Tops/Bottoms: Two candles with matching highs (tops, bearish) or lows (bottoms, bullish), indicating potential reversal.
Triple Candlestick Patterns
For more reliability, look at three-candle setups. Morning Star: Downtrend ends with a red candle, then a small-bodied one (like Doji), followed by a strong green—bullish reversal.
Evening Star: Uptrend with green, small body, then strong red—bearish. Three White Soldiers: Three consecutive green candles with higher closes, showing bullish continuation.
Three Black Crows: Three red candles with lower closes, bearish continuation.
Trading Candlestick Patterns Cheat Sheet Details
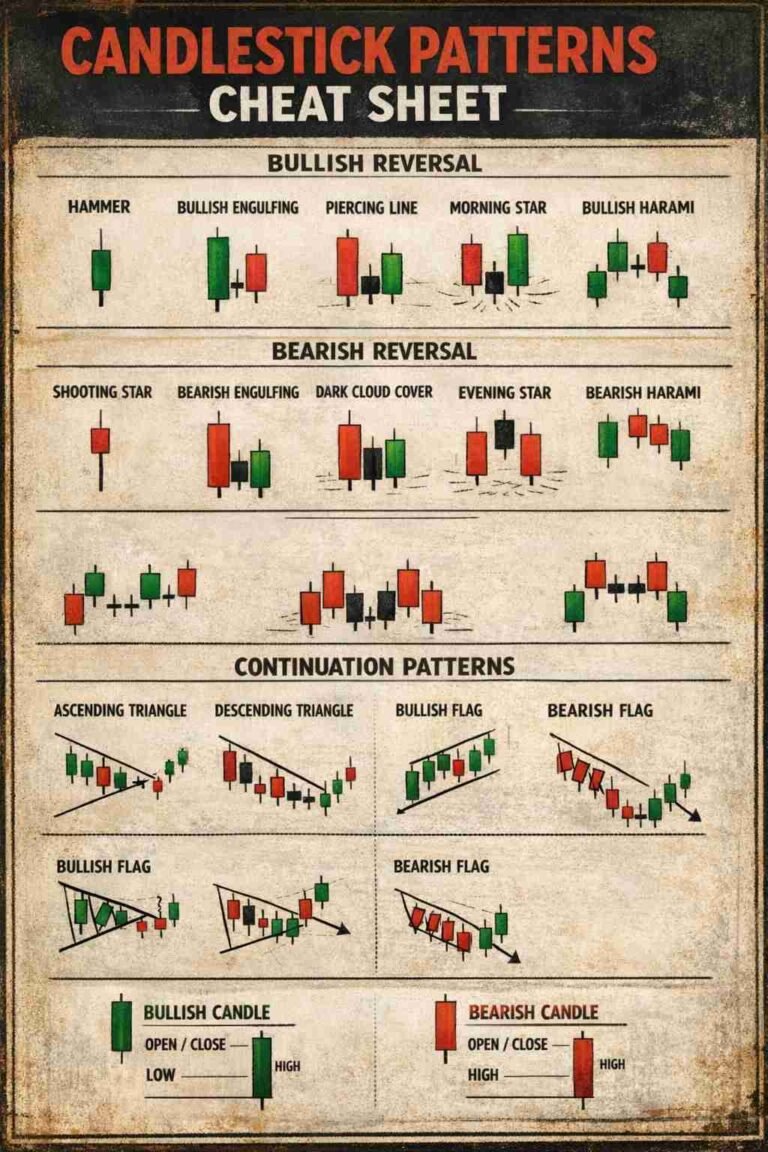
Here’s where we get to the heart of it: your trading candlestick patterns cheat sheet. This compiled list covers the most common patterns, their descriptions, and what they imply for the market. Use it as a quick reference, but remember, no pattern is foolproof—always confirm with other tools.
To make it comprehensive, I’ve included a wide range of patterns in the table below. The three columns break it down simply: Pattern Name, Description (how it looks), and Market Implication (bullish, bearish, or neutral, plus when it appears).
| Pattern Name | Description | Market Implication |
|---|---|---|
| Hammer | Small upper body (green or red), long lower wick, no or short upper wick. Appears at the bottom of a downtrend. | Bullish reversal: Suggests sellers exhausted, buyers taking over. Stronger if green. |
| Inverted Hammer | Small lower body, long upper wick, short or no lower wick. At downtrend end. | Bullish reversal: Indicates potential upside, but needs confirmation from next candle. |
| Bullish Engulfing | Red candle followed by larger green that fully covers the red body’s range. After downtrend. | Bullish reversal: Buyers overwhelm sellers, possible trend change. |
| Piercing Line | Red candle, then green opening below previous low but closing above midpoint of red body. | Bullish reversal: Partial recovery from downtrend, signaling strength. |
| Morning Star | Red candle, small-bodied (Doji-like) gap down, then strong green closing above midpoint. | Bullish reversal: Indicates shift after downtrend, like dawn breaking. |
| Three White Soldiers | Three consecutive green candles, each closing higher with small wicks. During uptrend or after down. | Bullish continuation: Steady buying pressure, trend likely to persist. |
| Bullish Harami | Large red candle, followed by small green inside the red’s body. End of downtrend. | Bullish reversal: “Pregnant” pattern showing hesitation, potential upturn. |
| Dragonfly Doji | Open, high, close same; long lower wick. At bottoms. | Bullish reversal: Sellers pushed low but buyers brought it back. |
| Shooting Star | Small lower body, long upper wick, short lower wick. At uptrend peak. | Bearish reversal: Buyers tried high but sellers dominated. |
| Hanging Man | Small upper body, long lower wick. Like Hammer but at uptrend end. | Bearish reversal: Warning of downside, especially if red. |
| Bearish Engulfing | Green candle followed by larger red engulfing it. After uptrend. | Bearish reversal: Sellers take control, potential downtrend start. |
| Dark Cloud Cover | Green candle, then red opening above previous high but closing below midpoint. | Bearish reversal: Clouds over uptrend, signaling weakness. |
| Evening Star | Green candle, small-bodied gap up, then strong red closing below midpoint. | Bearish reversal: Evening signal of trend end. |
| Three Black Crows | Three consecutive red candles, each closing lower with small wicks. During downtrend or after up. | Bearish continuation: Consistent selling, downtrend to continue. |
| Bearish Harami | Large green, small red inside it. End of uptrend. | Bearish reversal: Indecision after strength, possible downturn. |
| Gravestone Doji | Open, low, close same; long upper wick. At tops. | Bearish reversal: Buyers pushed high but sellers rejected it. |
| Doji | Open and close nearly equal, various wick lengths. Anywhere. | Neutral: Indecision; direction depends on prior trend and confirmation. |
| Spinning Top | Small body, long upper and lower wicks. In trends or ranges. | Neutral: Balance between buyers/sellers; potential reversal or pause. |
| Marubozu (Bullish) | Long green body, no wicks. Strong open to close rise. | Bullish momentum: Full buyer control, continuation likely. |
| Marubozu (Bearish) | Long red body, no wicks. Strong open to close drop. | Bearish momentum: Seller dominance, downtrend continuation. |
| Rising Three Methods | Long green, three small red corrections, then another long green. Uptrend. | Bullish continuation: Pullback but buyers resume. |
| Falling Three Methods | Long red, three small green rallies, then long red. Downtrend. | Bearish continuation: Temporary relief but sellers return. |
| Bullish Abandoned Baby | Downtrend Doji gap down from red, then green gap up. | Strong bullish reversal: Rare, like a baby left behind signaling change. |
| Bearish Abandoned Baby | Uptrend Doji gap up from green, then red gap down. | Strong bearish reversal: Isolation indicates sharp shift. |
| Tweezer Bottom | Two candles with matching lows, first red/second green. Downtrend end. | Bullish reversal: Support level hit twice, buyers defend. |
| Tweezer Top | Two with matching highs, first green/second red. Uptrend peak. | Bearish reversal: Resistance tested, sellers push back. |
| Three Inside Up | Bearish Harami confirmed by third green closing higher. | Bullish reversal: Builds on Harami with confirmation. |
| Three Inside Down | Bullish Harami confirmed by third red closing lower. | Bearish reversal: Confirms Harami downside. |
| Kicking (Bullish) | Bearish Marubozu followed by bullish Marubozu with gap. | Bullish reversal: Kicks off new uptrend aggressively. |
| Kicking (Bearish) | Bullish Marubozu followed by bearish Marubozu with gap. | Bearish reversal: Sudden shift downward. |
This table includes over 30 patterns to give you a thorough cheat sheet. Print it out or save it digitally for quick glances during trading sessions. Remember, patterns work best in context—check volume and support/resistance levels.
Strategies for Using Candlestick Patterns
Now that you have the cheat sheet, how do you apply it? Start by scanning charts for patterns at key areas like trendlines or moving average crossovers. For reversals, wait for confirmation: a Bullish Engulfing isn’t a buy signal until the next candle supports it.
Combine with other tools. Use RSI for overbought/oversold conditions— a Shooting Star at RSI 70+ is more bearish. In forex, pair with economic news; in stocks, watch earnings reports.
Risk management is key. Set stop-losses below pattern lows for longs, above highs for shorts. Aim for 1:2 risk-reward ratios. Backtest patterns on historical data to see what works in your market.
For day traders, focus on shorter timeframes with high-volume assets. Swing traders might use daily charts for multi-day holds. Always journal trades to learn from wins and losses.
Common Mistakes to Avoid When Trading Candlesticks
Newbies often trade patterns in isolation, ignoring the overall trend— a bullish pattern in a strong downtrend might fail. Overtrading is another pitfall: not every Doji is a signal; wait for confluence.
Ignoring volume can mislead; low-volume Engulfing might be noise. Emotional trading, like chasing patterns without plans, leads to losses. Lastly, don’t forget market context—holidays or news can override patterns.
Practice discipline: Use demo accounts, stick to rules, and review regularly. Over time, you’ll spot reliable setups faster.
Conclusion
Wrapping up, mastering candlestick patterns takes time but pays off in better trade decisions. This trading candlestick patterns cheat sheet serves as your handy reference, covering essentials from basics to advanced formations. Whether you’re a beginner or seasoned trader, incorporating these into your strategy in 2025 can help navigate volatile markets. Stay patient, keep learning, and trade smart.
FAQ
What are the most reliable candlestick patterns for beginners?
For starters, focus on Engulfing patterns (bullish and bearish) as they’re easy to spot and signal strong reversals. Hammers and Shooting Stars are also straightforward singles. Always confirm with volume and trends—reliability increases in trending markets over ranges.
How do I differentiate between bullish and bearish patterns?
Bullish patterns, like Morning Star or Bullish Engulfing, show buyers gaining control, often at downtrend ends with green bodies dominating. Bearish ones, such as Evening Star or Bearish Engulfing, indicate seller dominance, appearing at uptrend peaks with red candles prevailing. Neutral like Doji show balance.
Can candlestick patterns be used in all markets?
Yes, they’re versatile for stocks, forex, crypto, and commodities. In volatile markets like crypto, they shine for quick reversals; in stocks, combine with fundamentals. Adjust timeframes: short for intraday, longer for swings. They work best with liquid assets.
What tools should I use alongside candlestick patterns?
Pair with indicators like moving averages for trends, RSI for momentum, and volume for confirmation. Support/resistance levels add context. Charting software like TradingView helps visualize. For advanced, use backtesting tools to test patterns historically.
Are there any updates to candlestick patterns in 2025?
Core patterns remain timeless, but with AI trading tools, patterns are analyzed faster via algorithms. Focus on hybrid strategies blending candlesticks with machine learning signals. Sustainability trends in markets might influence patterns in green stocks, but basics stay the same.